Chloride Testing
Fiscal Year:
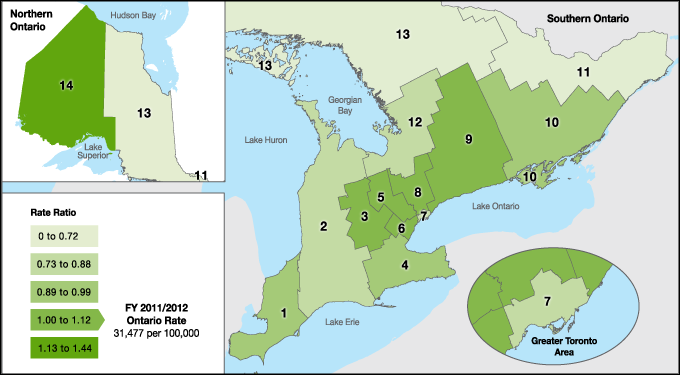
Note: There have been changes to the coding method used to obtain data for some interventions included in this report compared to previous reports. Therefore there may be some observed differences between the current data and earlier issues of Maps reports. Observed differences over time or between LHINs remain accurate within the scope of the applied methodology.
| Ontario LHINS | Region Number |
|---|---|
| Erie St. Clair | 1 |
| South West | 2 |
| Waterloo Wellington | 3 |
| Hamilton Niagara Haldimand Brant | 4 |
| Central West | 5 |
| Mississauga Halton | 6 |
| Toronto Central | 7 |
| Central | 8 |
| Central East | 9 |
| South East | 10 |
| Champlain | 11 |
| North Simcoe Muskoka | 12 |
| North East | 13 |
| North West | 14 |
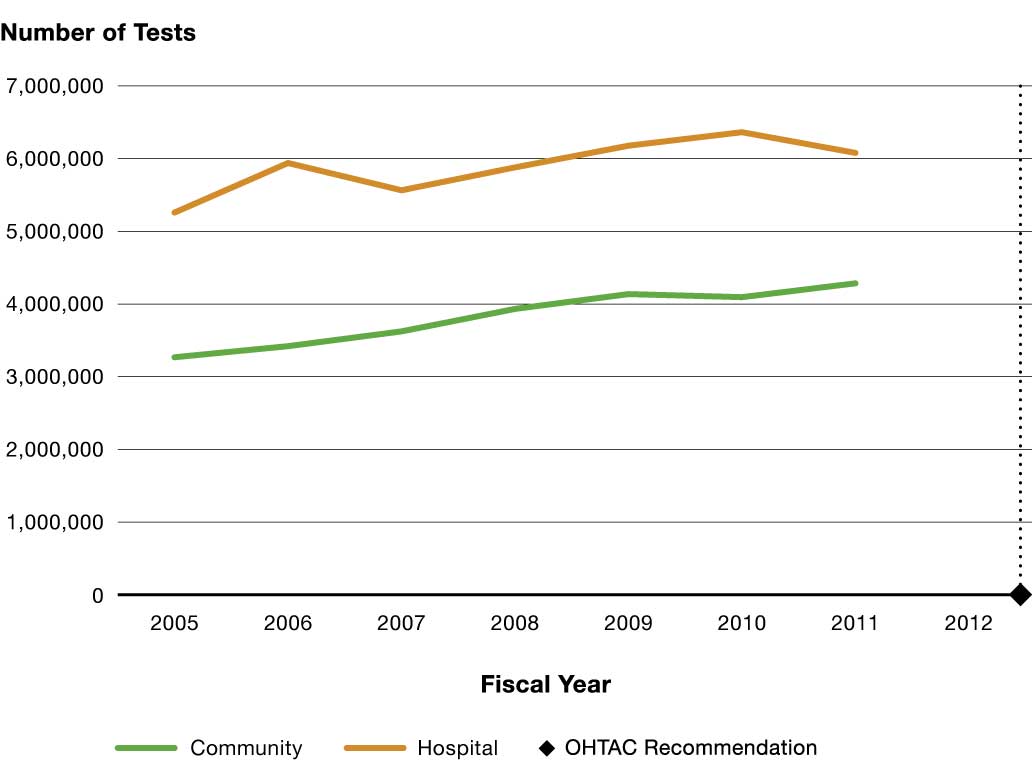
Note: hospital laboratory volumes included in the figure do not correspond to the fiscal year, as volumes are provided to the Ministry of Health and Long-Term Care on an annual basis when each laboratory submits its annual licence.